










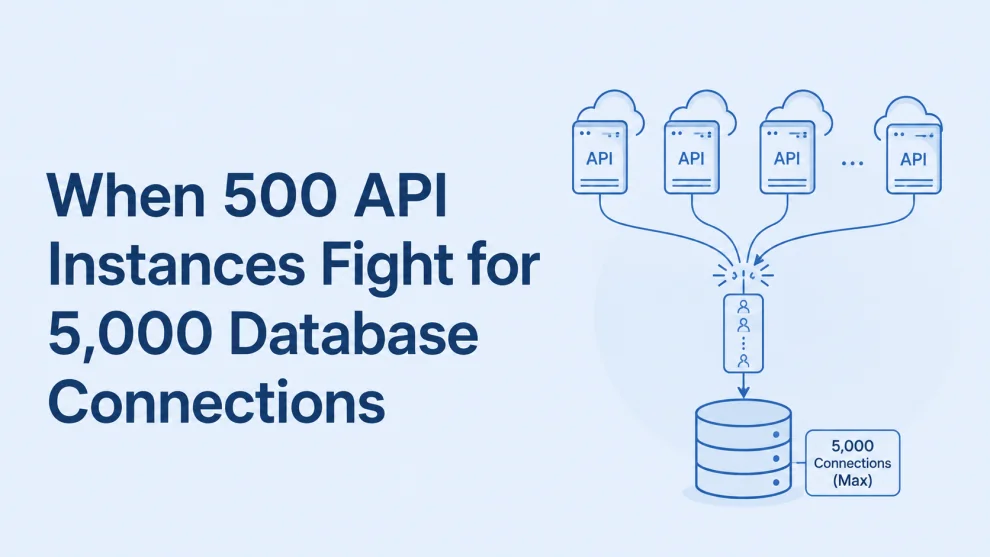

Scaling a backend horizontally sounds straightforward. Traffic increases, Kubernetes adds more pods, and the application handles more requests. But at enterprise scale, this assumption can create a dangerous bottleneck: the application can scale much faster than the database underneath it.
Consider a Node.js backend running 50 Kubernetes pods, with each pod configured for a maximum database pool of 50 connections. The theoretical connection demand is already 2,500 connections. If traffic spikes and Kubernetes scales the service to 200 pods, that same configuration can create demand for as many as 10,000 connections. If the database can safely handle only 5,000, the application has effectively scaled itself into an outage.
The Problem With Scaling Only the Application Layer
This problem is easy to miss because CPU and memory may look perfectly normal. A pod waiting for a database connection does not necessarily consume significant CPU. Kubernetes sees a healthy container, while users experience increasing API latency.
That creates a dangerous mismatch between infrastructure health and application health. A backend can report low CPU, normal memory, healthy pods, and no container crashes while database wait time and request latency continue climbing.
For enterprise engineering teams, this means database capacity has to be part of the application’s scaling model. The basic calculation is straightforward: maximum application replicas multiplied by maximum connections per replica equals potential database connection demand. If a service can scale to 300 pods and each pod can open 20 connections, the application could potentially request 6,000 connections. If the database’s safe operating limit is 4,000, the architecture already contains a capacity mismatch.
More Connections Do Not Mean More Throughput
A common response to connection pressure is to increase the database’s maximum connections. That can postpone the problem, but it does not necessarily solve it.
Database connections compete for CPU, memory, locks, buffers, and I/O. Increasing concurrency beyond what the database can efficiently process can actually make query performance worse. A database with 5,000 connections does not automatically process five times more useful work than one with 1,000 connections.
The objective should therefore be controlled concurrency, not maximum concurrency.
Backend teams should understand how long queries hold connections, how many concurrent queries the database can process efficiently, and where connection acquisition begins to become a bottleneck. Connection pool configuration should be treated as part of capacity planning rather than as a default framework setting.
How One Slow Query Becomes a Production Incident
Imagine an API query that normally takes 20 milliseconds. A deployment changes its execution plan and the same query begins taking 500 milliseconds. Each connection now remains occupied for significantly longer, requests begin waiting, pools fill up, and API latency rises.
The application may then scale from 50 pods to 150 pods because traffic or latency triggers autoscaling. Unfortunately, every new pod creates another connection pool. Instead of solving the problem, scaling adds more potential pressure to the database.
The failure chain becomes: slow query, longer connection occupancy, pool exhaustion, higher API latency, more concurrent requests, more application pods, more database connections, and eventually widespread degradation.
The original problem was a query. The production incident became an architecture problem.
CPU-Based Autoscaling Can Miss the Real Bottleneck
Many backend environments still rely heavily on CPU utilization for autoscaling. That works well when the workload is primarily CPU-bound, but database-heavy services can behave very differently.
A service may have 35% CPU utilization while 95% of its database connections are occupied. If the autoscaler is watching only CPU, it may decide that additional capacity is unnecessary. From the user’s perspective, however, the application is already becoming slow.
For database-intensive APIs, engineering teams should consider metrics such as request latency, connection-pool utilization, database wait time, active queries, query duration, queue depth, database CPU, I/O, and lock contention. The goal is to understand whether the application is actually processing work or simply waiting for another layer.
Background Jobs Should Not Compete With Customer Traffic
Another common source of database pressure is asynchronous work running alongside transactional APIs.
A customer-facing service might process orders while background workers simultaneously generate reports, synchronize external systems, update search indexes, and process analytics events. If all of these workloads use the same database without concurrency controls, background processing can consume resources needed by critical transactions.
Queues provide one way to separate these workloads. Instead of allowing thousands of background jobs to hit the database simultaneously, jobs can enter a queue and workers can process them at a controlled rate.
This introduces a different metric to watch: queue backlog. A growing queue is not automatically a failure. In many cases, temporarily delaying non-critical work is preferable to allowing that work to overwhelm the database and affect customer-facing transactions.
Read Replicas Solve Only Part of the Problem
Read replicas can reduce pressure on a primary database for read-heavy workloads, but they do not eliminate the fundamental challenge.
Transactions such as payments, inventory updates, account changes, and order processing may still depend on the primary database. An organization can operate multiple read replicas while a single primary database remains the bottleneck for critical writes.
Backend architecture therefore needs to distinguish between read scalability and transactional scalability. The right solution might involve query optimization, partitioning, caching, workload separation, asynchronous processing, or changes to the data model rather than simply adding more replicas.
The Hidden Cost of Third-Party Dependencies
Database pressure is not the only backend bottleneck. External APIs can create similar problems when they are placed directly inside synchronous request paths.
A checkout API might call payment verification, fraud detection, inventory, shipping, and notification services before returning a response. If one dependency becomes slow, the application may keep requests open for longer, consuming threads, connections, memory, and other resources.
Enterprise backends should therefore establish clear timeouts, retry policies, circuit breakers, rate limits, idempotency controls, and fallback behavior for critical external dependencies.
A dependency should not be allowed to turn a temporary slowdown into a full application failure.
Observability Has to Follow the Request
Monitoring individual services is not enough when a single request crosses multiple backend components. If a transaction takes four seconds, engineers need to know where those four seconds were spent.
A typical request might travel through an API gateway, authentication service, order service, inventory service, payment provider, and database. Distributed tracing allows engineers to follow the request across those boundaries and identify whether the delay came from application logic, database queries, network calls, or external dependencies.
This becomes particularly valuable during incidents. Instead of asking several teams to inspect separate dashboards, engineers can trace the request path and identify the slowest component.
Where AI Can Add Another Layer of Context
Once backend environments generate large volumes of logs, traces, deployments, incidents, tickets, and engineering discussions, another challenge appears: humans have to connect those signals.
AI can help correlate them. For example, a system could identify that a deployment occurred shortly before query duration increased, connection-pool utilization climbed, Kubernetes scaled additional pods, and API latency began rising.
That does not mean AI should automatically change database configuration in production. A more practical enterprise model is to use AI for signal correlation, incident summaries, risk identification, and recommended actions while engineers retain approval over consequential changes.
This is also where GeekyAnts’ AI Signal Bot fits naturally into the broader engineering workflow. Its focus on identifying risks, blockers, ownership, deadlines, and actionable signals from team conversations reflects a wider shift toward connecting operational information with the people responsible for acting on it.
What Enterprise Engineering Leaders Should Audit
For organizations operating hundreds of backend services, the most useful scalability review may begin with a simple question: What happens to the database when the application reaches its maximum replica count?
Teams should know the maximum number of application instances, the connection pool size per instance, the database’s safe connection capacity, the queries consuming the most connection time, and what happens when the pool is exhausted. They should also know which workloads can be moved to queues, which endpoints create the highest database load, and whether autoscaling considers application and database signals together.
These details are easy to overlook when each layer is managed independently. They become critical when the system is operating under real production pressure.
The Real Backend Scaling Problem
The old backend scaling question was simple: Can we add more servers?
The enterprise version is much harder: What becomes the bottleneck when every layer scales?
It might be database connections. It might be query throughput, queue processing, cache capacity, external API limits, storage I/O, or a single transactional system.
The important point is that scaling one layer does not automatically scale the system.
A backend is a chain of dependencies, and the weakest capacity boundary can determine the behavior of the entire application.
That is why 500 healthy API instances can still produce a production outage.
They may all be waiting for the same database.
For more, visit our homepage!



Add Comment